Kevin L. Michel · FY2027 rent research
Same budget.
Different rent estimate.
Different answer.
A rent estimate for a whole housing area can tell a different story from an estimate for one ZIP. This study measures how often that changes a simple rental-budget check.
One income. One rule. Two estimates.
One bedroom · New York, NY HUD Metro FMR Area
35% is a sensitivity assumption, not a recommended budget.
Start with the idea
Change the rent number.
Keep the household the same.
Imagine checking whether a rent estimate fits a household’s budget. You choose an annual income, set the share allowed for rent, and divide by 12. An estimate at or below that monthly limit passes the screen. Anything higher fails.
The paper applies the same rule to two HUD measures of gross rent. Gross rent includes relevant tenant-paid utilities, so those same utility costs should not be added again.
The area estimate FMR
One bedroom-specific rent estimate for the official HUD housing area. These areas can cross city, county, and state boundaries.
The local estimate SAFMR
A bedroom-specific estimate for a ZIP within a HUD area. A ZIP code alone is not always enough to identify the right record.
These are HUD estimates used for housing policy. They are not advertised apartments, and they do not guarantee a home is available at that price. Passing this one rule does not establish overall affordability.
The headline finding
The disagreement runs both ways.
One bedroom. A hypothetical $100,000 household income. A 30% rent share. The monthly limit is $2,500 in both examples.
Area fails · some local estimates pass
Boston
61.39%
159 / 259 local benchmark records give a different answer.
Area estimate: $2,518 · Fails
The area estimate sits just above the budget. Many local estimates are low enough to pass.
Boston-Cambridge-Quincy, MA-NH HUD Metro FMR AreaArea passes · some local estimates fail
Seattle
20.26%
31 / 153 local benchmark records give a different answer.
Area estimate: $2,180 · Passes
The area estimate is below the budget. Some local estimates are too high to pass.
Seattle-Bellevue, WA HUD Metro FMR AreaCounts are unweighted ZIP-area benchmark records, not homes or people. Each percentage uses that market’s own denominator. Short city names label the official HUD areas shown above.
Explore all eight markets
When does the rent number change the answer?
Choose a hypothetical household income, unit size, and rent limit. Each market shows how often its area estimate and local ZIP-level estimates give different pass/fail answers.
$100,000 × 30% ÷ 12 months
Primary scenario: one bedroom, 30% rent share.
An estimate passes when it is at or below the limit. Gross rent includes relevant tenant-paid utilities. Passing this one rule does not establish overall affordability.
- Both pass
- Area fails · local passes
- Area passes · local fails
- Both fail
New York
410 records- Area fails → local passes
- 61/410 (14.88%)
- Area passes → local fails
- 0/410 (0.00%)
- Both pass
- 0/410 (0.00%)
- Both fail
- 349/410 (85.12%)
Which HUD area?
New York, NY HUD Metro FMR Area
METRO35620MM5600Atlanta
299 records- Area fails → local passes
- 0/299 (0.00%)
- Area passes → local fails
- 0/299 (0.00%)
- Both pass
- 299/299 (100.00%)
- Both fail
- 0/299 (0.00%)
Which HUD area?
Atlanta-Sandy Springs-Roswell, GA HUD Metro FMR Area
METRO12060M12060Boston
259 records- Area fails → local passes
- 159/259 (61.39%)
- Area passes → local fails
- 0/259 (0.00%)
- Both pass
- 0/259 (0.00%)
- Both fail
- 100/259 (38.61%)
Which HUD area?
Boston-Cambridge-Quincy, MA-NH HUD Metro FMR Area
METRO14460MM1120Chicago
370 records- Area fails → local passes
- 0/370 (0.00%)
- Area passes → local fails
- 35/370 (9.46%)
- Both pass
- 335/370 (90.54%)
- Both fail
- 0/370 (0.00%)
Which HUD area?
Chicago-Joliet-Naperville, IL HUD Metro FMR Area
METRO16980M16980Washington
488 records- Area fails → local passes
- 0/488 (0.00%)
- Area passes → local fails
- 96/488 (19.67%)
- Both pass
- 392/488 (80.33%)
- Both fail
- 0/488 (0.00%)
Which HUD area?
Washington-Arlington-Alexandria, DC-VA-MD HUD Metro FMR Area
METRO47900M47900Seattle
153 records- Area fails → local passes
- 0/153 (0.00%)
- Area passes → local fails
- 31/153 (20.26%)
- Both pass
- 122/153 (79.74%)
- Both fail
- 0/153 (0.00%)
Which HUD area?
Seattle-Bellevue, WA HUD Metro FMR Area
METRO42660MM7600Philadelphia
473 records- Area fails → local passes
- 0/473 (0.00%)
- Area passes → local fails
- 0/473 (0.00%)
- Both pass
- 473/473 (100.00%)
- Both fail
- 0/473 (0.00%)
Which HUD area?
Philadelphia-Camden-Wilmington, PA-NJ-DE-MD MSA
METRO37980M37980Raleigh
86 records- Area fails → local passes
- 0/86 (0.00%)
- Area passes → local fails
- 0/86 (0.00%)
- Both pass
- 86/86 (100.00%)
- Both fail
- 0/86 (0.00%)
Which HUD area?
Raleigh-Cary, NC MSA
METRO39580M39580Exact equality cases and the full count table
An estimate exactly equal to the unrounded budget limit passes. The table counts local equality cases separately; those records are already included in the passing outcomes above.
| HUD market | Both pass | Area fails, local passes | Area passes, local fails | Both fail | Local equals budget | Area equals budget? |
|---|---|---|---|---|---|---|
| New York | 0/410 (0.00%) | 61/410 (14.88%) | 0/410 (0.00%) | 349/410 (85.12%) | 4/410 (0.98%) | No |
| Atlanta | 299/299 (100.00%) | 0/299 (0.00%) | 0/299 (0.00%) | 0/299 (0.00%) | 0/299 (0.00%) | No |
| Boston | 0/259 (0.00%) | 159/259 (61.39%) | 0/259 (0.00%) | 100/259 (38.61%) | 1/259 (0.39%) | No |
| Chicago | 335/370 (90.54%) | 0/370 (0.00%) | 35/370 (9.46%) | 0/370 (0.00%) | 0/370 (0.00%) | No |
| Washington | 392/488 (80.33%) | 0/488 (0.00%) | 96/488 (19.67%) | 0/488 (0.00%) | 13/488 (2.66%) | No |
| Seattle | 122/153 (79.74%) | 0/153 (0.00%) | 31/153 (20.26%) | 0/153 (0.00%) | 0/153 (0.00%) | No |
| Philadelphia | 473/473 (100.00%) | 0/473 (0.00%) | 0/473 (0.00%) | 0/473 (0.00%) | 0/473 (0.00%) | No |
| Raleigh | 86/86 (100.00%) | 0/86 (0.00%) | 0/86 (0.00%) | 0/86 (0.00%) | 0/86 (0.00%) | No |
Counts describe unweighted ZIP-area benchmark records, not available homes or people. City labels stand for the full HUD areas shown in each card. Budget amounts are displayed to two decimal places; classifications use unrounded calculations. Source: the paper’s archived FY2027 schedules and replication data.
A closer look · ZIP 11103
The rents stay fixed.
The rule changes.
For a one-bedroom unit in the New York HUD area, the local estimate is $581 a month higher than the area estimate, or $6,972 a year. Keep household income at $100,000 and try the three rent shares.
Monthly limit $2,916.67Display rounded to cents; pass/fail uses the unrounded limit.
At 35%, the area estimate passes and the ZIP estimate fails.
The gold marker is the monthly budget limit. The bars are monthly HUD gross-rent estimates, not apartment listings. An estimate exactly at the limit passes.
Go deeper
Three views from the paper.
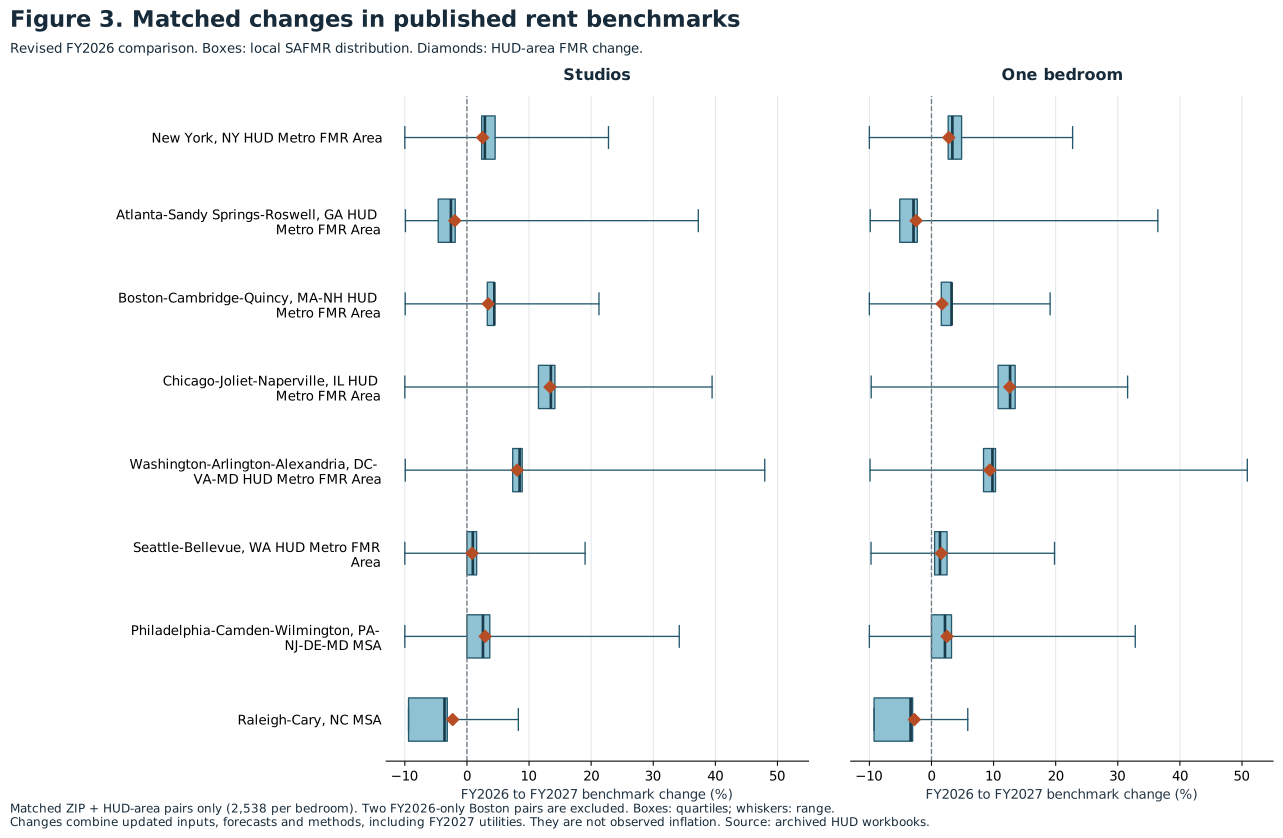
The original figures show the spread of local estimates, differences in screening results, and changes between the two HUD schedules. Open each chart to see the full detail.
Figure 1 · The spread within each marketHow far apart are the rent estimates?+
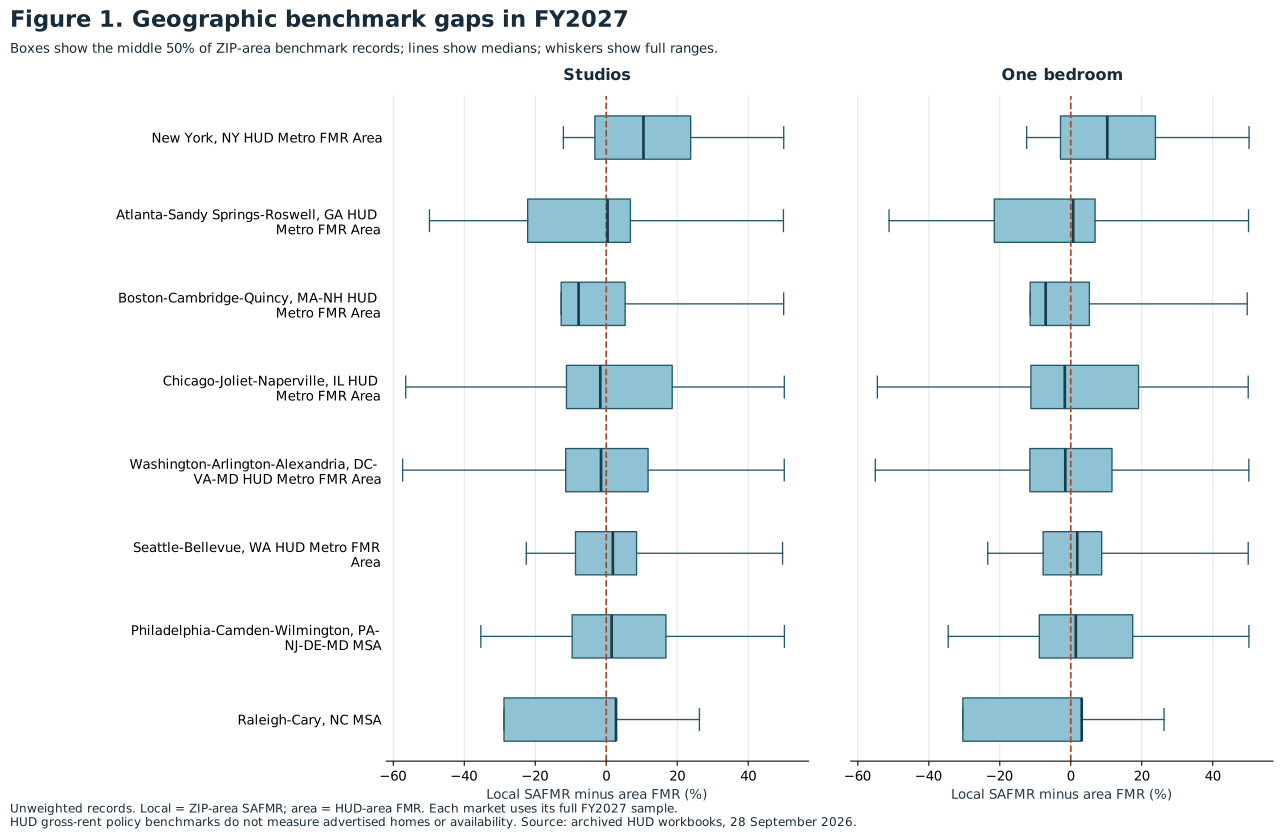
Figure 2 · Income and bedroom sensitivityWhen does the answer change?+
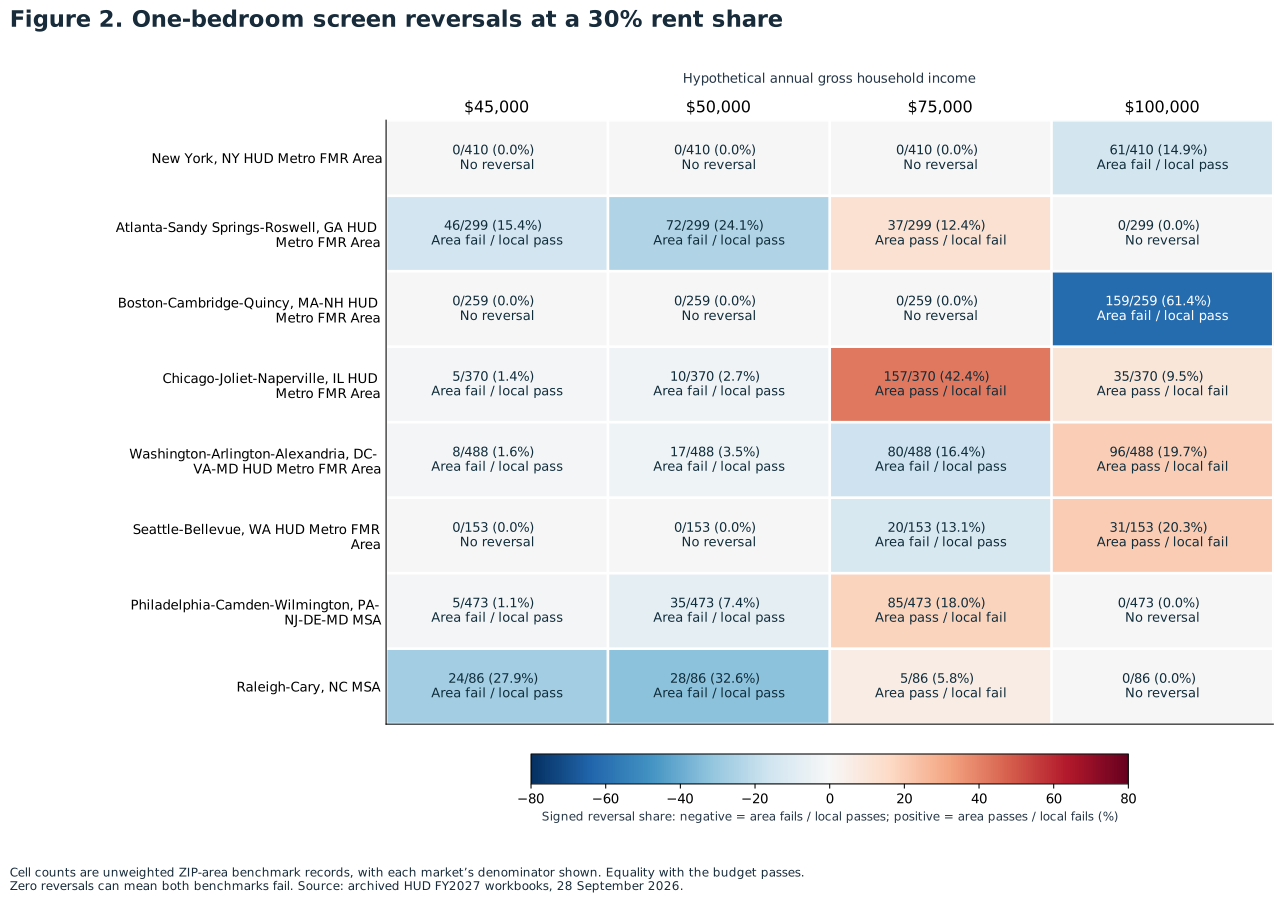
Figure 3 · Revised FY2026 to FY2027What changed between the schedules?+
Why the source handling matters
The answer should be traceable.
The contribution is an updated, reproducible audit of a screening decision. Earlier research already established that rent geography matters. This paper makes the assumptions and source handling visible across eight job-relevant markets.
Same files, known versions.
The analysis preserves the September 28, 2026 snapshot. The paper records official source URLs, checksums, and the original source-status check. Publishing this guide does not update those schedules.
A ZIP is not a unique key.
The analysis identifies a record using ZIP + HUD area + year + bedroom size. It checks county and town rows before joining local estimates to one area estimate.
Fix metadata, preserve rent cells.
One FY2026 workbook contained malformed internal dates. A derived copy repairs only that metadata; the other archive entries remain unchanged. No numeric cells were edited.
Benchmarks, not lived outcomes.
All 2,538 FY2027 ZIP-area records match the revised FY2026 sample. Its two extra records stay in an exceptions table. A separate 24-case audit checks documented source methods.
What this study can and cannot tell us
It describes how a stated rent-to-income rule responds to the choice of rent estimate. It does not estimate a policy’s causal effect, count available apartments, or predict what an individual household will actually pay.
Income is hypothetical gross household income before taxes. Food, childcare, transport, debt, and other costs are outside the study. The 35% and 40% rent shares are alternative assumptions, not financial recommendations.
The primary analysis covers studios and one-bedroom units at 30%. Two-bedroom units test bedroom sensitivity. Changes from revised FY2026 to FY2027 are benchmark changes, not observed inflation. HUD’s utility method also changed.
The 24 provenance cases were deliberately selected. Their method mix does not estimate how common each method is across all records. The full paper documents predecessors, the limited search for newer work, and remaining limitations.
Read it. Check it. Reproduce it.
The complete research,
open to everyone.
When a Metro Rent Number Changes the Answer: A FY2027 Audit of Rental-Budget Screening Across Eight U.S. Job Markets
Kevin L. Michel · September 29, 2026
The supplied publication files are preserved unchanged. No account is required.