A neighbor gets a lower quote. This is excellent news for the neighbor and the beginning of several questions for you.
The houses are close. They face the same sky. From the street, neither looks much harder to repair than the other. It is tempting to treat the difference as proof that your insurer is charging too much, or that the neighbor has found the answer.
Perhaps there is a better offer. It is worth checking. But before we can compare the prices, we need to know what each one buys. A larger deductible, a lower limit or a different way of paying for an old roof can change the comparison. So can differences between the buildings that are hard to see from the pavement.
Then there is the insurer itself. A company does not price one home in isolation. It has other promises to keep, money it must have available and its own arrangements for sharing large losses.
Your premium carries all of this into a single amount due. To understand that amount, we have to take it apart without pretending we can reconstruct the insurer’s private calculation from the bill.
Many small payments and one large loss
Insurance begins with a helpful possibility. Many people can pay smaller amounts into a system that pays larger amounts to those who suffer covered losses. Each household does not have to keep the full rebuilding cost ready in a bank account.
That idea works differently when losses arrive together. If one kitchen catches fire, the damage may be confined to one building. If a major windstorm crosses a town, many policyholders can need help at once. A company that insures a large share of that town has made many promises exposed to the same event.
The word for losses that move together is correlation. We do not need the word to feel the problem. Imagine a group of ten friends agreeing to help whichever one loses a week’s wages. Then imagine they all work at the same place and it closes. The promise has changed, even though the agreement’s wording has not.
Insurers can spread their business across places and buy reinsurance, which is insurance for some of their own losses. Neither makes the original damage vanish. They change which balance sheet must meet it. If the cost of carrying that risk rises, it can become part of the price of the policies sold to households.
There are other costs in running an insurer, and actual prices depend on contracts and market rules. A useful first model is therefore broader than next year’s expected claims. The insurer must be able to carry uncertain claims, pay operating costs and support the capital behind its promises. The details of competition and regulation also matter.1
This helps explain why your own good claims history cannot settle the whole price. Your experience is relevant, but the company is selling a promise that extends beyond what happened to you last year.
It also explains why a quiet year is welcome without being proof of safety. A household can have no loss while remaining exposed to one. A pool can have a good year while still needing resources for a bad one. The hard question is whether the price and the promise are reasonable for the risk and protection involved. One undamaged year cannot answer it.
The climate signal inside a larger price
The Fifth National Climate Assessment describes a climate warmed by human emissions and changes in damaging extremes. Its conclusions differ by hazard and region. Heavy-rain evidence is not interchangeable with evidence about hail or hurricane counts. The assessment, for example, does not find a long-term rise in the frequency of hurricanes making U.S. landfall since the late nineteenth century. Exposure and vulnerability also shape losses.2
These distinctions help us think more clearly. A change in storm conditions can raise expected damage. More homes placed in harm’s way can raise the amount at risk. More costly materials can raise the repair bill for the same damage. A different contract can change how much of that bill an insurer pays.
Several of these changes can occur together. If we call the whole premium increase climate change, we lose the ability to ask which part could be reduced by stronger construction, different coverage, better competition or a change in the way risk is shared. If we ignore the changing hazard, we can design a cheaper contract around a problem that is growing.
I want the discussion to be precise because the choices are expensive. A household deciding whether to strengthen a roof needs an answer about that building and the relevant danger. A regulator reviewing rates needs evidence about costs, assumptions and the insurer’s obligations. A town approving new homes needs to consider the roads, drainage and future public expenses as well as the sale.
No single premium can do all of those jobs.
What one public file can actually tell us
The U.S. Treasury’s 2025 homeowners-insurance report studied 2018 through 2022. Its sample focused on common owner-occupied policy forms and did not include flood insurance. It found differences in cost and availability across areas with different modeled climate-related risks. The published data are a restricted subset, rather than a complete record of every home and insurer.1
For this book, I asked a narrower question of the public workbook: how much do its reported ZIP-level premium measures vary within a single year, and does that spread remain when we compare ZIPs in the same reported policy-size group?
The workbook defines its premium measure as written premium divided by the number of policies in force at year end. Its policy-size groups refer to numbers of policies, not the size of houses or their coverage limits. Each ZIP contributes one row to our comparison, whether it contains relatively few covered policies or many. The public file does not give the exact policy counts needed to weight those rows into a policyholder average.
In the 2022 data there are 25,593 released ZIP rows. Put their premium measures in order from low to high. The middle value is the median. A value at the tenth percentile has about a tenth of the observations below it; the ninetieth percentile has about nine tenths below it. These positions show the spread without asking the single highest or lowest observation to represent a whole group.
The chart expresses each value as a multiple of the overall median. One means equal to that median. A value of one and a half means fifty percent higher. Using ratios lets us compare this single year’s spread without assigning an undocumented purchasing-power base to the released dollars.
Wide spreads within each size group
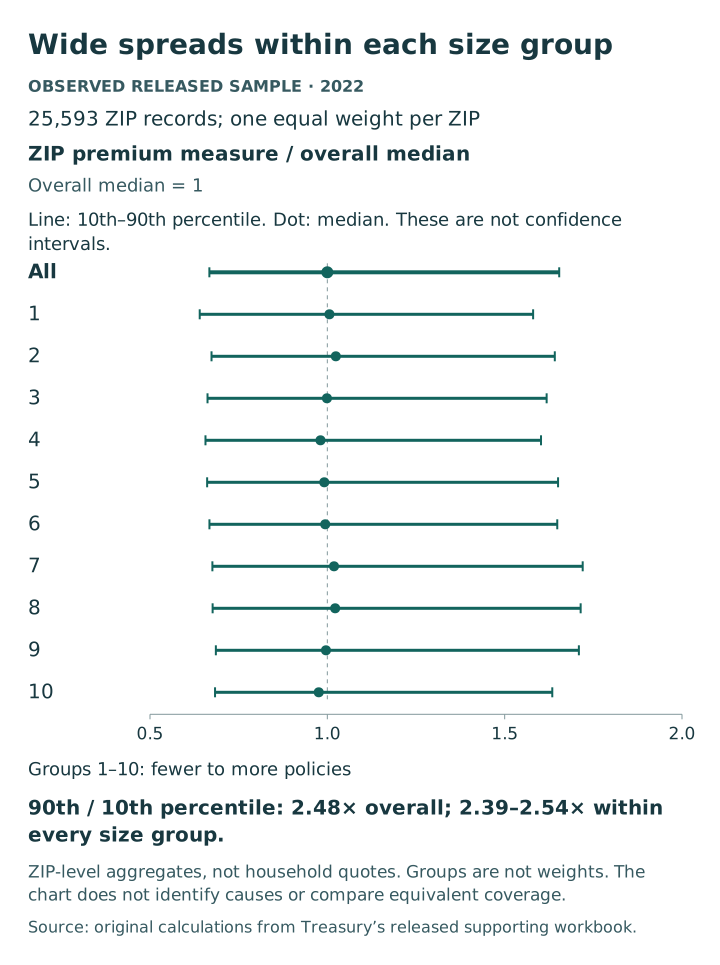
| Policy-size group | Values and meanings |
|---|---|
| All released ZIPs |
Released ZIPs: 25,593 10th percentile / overall median: 0.67 Group median / overall median: 1.00 90th percentile / overall median: 1.65 90th / 10th percentile: 2.48 |
| 1 |
Released ZIPs: 2,208 10th percentile / overall median: 0.64 Group median / overall median: 1.01 90th percentile / overall median: 1.58 90th / 10th percentile: 2.47 |
| 2 |
Released ZIPs: 2,516 10th percentile / overall median: 0.67 Group median / overall median: 1.02 90th percentile / overall median: 1.64 90th / 10th percentile: 2.44 |
| 3 |
Released ZIPs: 2,492 10th percentile / overall median: 0.66 Group median / overall median: 1.00 90th percentile / overall median: 1.62 90th / 10th percentile: 2.44 |
| 4 |
Released ZIPs: 2,613 10th percentile / overall median: 0.66 Group median / overall median: 0.98 90th percentile / overall median: 1.60 90th / 10th percentile: 2.44 |
| 5 |
Released ZIPs: 2,567 10th percentile / overall median: 0.66 Group median / overall median: 0.99 90th percentile / overall median: 1.65 90th / 10th percentile: 2.50 |
| 6 |
Released ZIPs: 2,616 10th percentile / overall median: 0.67 Group median / overall median: 0.99 90th percentile / overall median: 1.65 90th / 10th percentile: 2.47 |
| 7 |
Released ZIPs: 2,630 10th percentile / overall median: 0.68 Group median / overall median: 1.02 90th percentile / overall median: 1.72 90th / 10th percentile: 2.54 |
| 8 |
Released ZIPs: 2,572 10th percentile / overall median: 0.68 Group median / overall median: 1.02 90th percentile / overall median: 1.71 90th / 10th percentile: 2.53 |
| 9 |
Released ZIPs: 2,591 10th percentile / overall median: 0.69 Group median / overall median: 1.00 90th percentile / overall median: 1.71 90th / 10th percentile: 2.49 |
| 10 |
Released ZIPs: 2,788 10th percentile / overall median: 0.68 Group median / overall median: 0.98 90th percentile / overall median: 1.63 90th / 10th percentile: 2.39 |
One equal weight per released ZIP. Source measure: written premium / year-end policies. Groups order ZIPs by policy count and are not numerical weights. No dollar base or time trend is assigned. Suppressed ZIPs and exact policy weights are unavailable. Coverage, property values, insurer mix, and risks are not held fixed; no household estimate or climate-causal claim follows.
Original calculations from U.S. Treasury public supporting workbook, 2022 rows
Figure 2. The released ZIP measures vary widely even within their reported policy-size groups.
Across all released 2022 ZIPs, the ninetieth-percentile measure is about 2.48 times the tenth-percentile measure. When the rows are separated into their ten reported policy-size groups, that ratio ranges from about 2.39 to 2.54. The spread does not disappear simply because we compare rows within those broad size groups.3
There is an important limit here. A size group is a category, not a count of policies and not a measure of climate risk. This exercise does not hold building quality, insured value, coverage, location or insurer mix constant. It cannot tell us which of those differences produced the spread.
We also checked whether a few unusual rows were doing the work. Keeping all rows is the main result. Removing twenty-nine ZIPs flagged for unusual values in other reported measures leaves the overall ratio almost unchanged, at about 2.48. In a separate check, trimming the bottom and top one percent of premium observations gives about 2.41. Those checks do not certify every record. They show that this particular comparison is not driven only by the most extreme premium values or the flagged rows.
The useful lesson is modest. A broad public summary contains a lot of variation, even before we reach an individual house. The data give us a reason to ask for a relevant quote and its terms. They do not give us a shortcut around doing so.
Why the missing weights matter
Suppose one district has ten policies averaging one amount and another has a thousand policies averaging a different amount. Giving the two districts equal influence answers a question about districts. Giving each policy equal influence answers a question about policies.
Both calculations can be correct, and they can produce different results. Trouble begins when we do the first and label it as the second.
The Treasury workbook publishes policy-size categories but not the exact counts. We cannot repair that by using a category number as a weight. Group ten is not necessarily ten times group one. We also cannot recover records that were left out of the public release by assuming they resemble the records we can see.
This is why the analysis here does not claim to reproduce Treasury’s national premium figure. It uses the information actually available to answer a smaller question. The missing information is part of the result.
I linger on this because readers are often offered confident maps and averages when what they need is a decision about one home. A statistic can be sound and still be the wrong tool for that decision. A national average does not become a quote because it is easy to find. A ZIP measure does not tell you whether your particular roof, policy or renewal will be treated the same way.
Good research should make the boundaries of a number easier to see. It should not make the number look more personal than it is.
Ask what changed before deciding what to change
Now return to the neighbor’s quote. There are several possible conversations.
One compares similar protection from different companies. Another compares a broad contract with a narrower one. A third discovers that an important feature of one house differs from the other. These are not small technicalities. They tell you whether the apparent saving comes from shopping, from transferring more risk back to yourself or from a genuinely different exposure.
The most helpful comparison starts with the same facts about the house and a clear description of the protection being offered. If a quote changes a deductible, ask for its dollar consequence in a relevant loss. If a roof is treated differently, ask how its age affects a payment. If one offer excludes a cause of damage, leave that difference visible instead of placing the prices side by side as though nothing else changed.
Then ask the question that does not fit neatly on a comparison website: what could I still have to find in cash, and when?
A household may reasonably accept more of a loss in exchange for a lower premium. Someone with very limited savings may be unable to carry that same choice. We should not mistake one person’s workable trade-off for another person’s irresponsibility. Their resources and obligations differ.
Nor should every decision be framed as choosing the cheapest contract that a lender will accept. The lender has a particular interest in the property. You have an interest in living there, replacing belongings, meeting other expenses and getting through the disruption. The overlap is real, but it is not complete.
There is a larger public task as well. People should be able to understand why protection has become more costly or harder to obtain. That requires clear policy language and credible information about markets, losses and coverage. It requires regulators and researchers to explain what their data measure. A household should not need to become an actuary to discover that two prices buy different promises.
The neighbor may still have found a better offer. By all means, ask who supplied it. Just bring the rest of the questions with you.
Footnotes
-
Federal Insurance Office, Analyses of U.S. Homeowners Insurance Markets 2018–2022, January 2025, methodology and cost discussion. Descriptive comparisons do not isolate a climate-change effect. ↩ ↩2
-
Marvel and colleagues, Fifth National Climate Assessment, Chapter 2, 2023, especially pages 2-4–2-5 and 2-16–2-20. Different hazards have different evidence and confidence levels. ↩
-
Original calculations from Treasury’s supporting workbook, 2022 rows only. Equal weight per released ZIP; interpolated percentiles; all rows retained in the main result. Neither policyholder weights nor a causal climate model is used. ↩