The loading stops because the machine does not know where part of itself is.
In a documentary released by WELT in 2021 about the Port of Hamburg, a crane operator describes a problem with a two-trolley system. One trolley transfers a container for the other to carry onward. The control system has lost a reliable position for one of them. Continuing could risk a collision, so movement is locked out. A supervisor restores the position information. The work resumes.1
For a little while, no container moves. If you judged the operation only by its output during those minutes, you would see a failure. If you understood what the pause prevented, you would see a safety system doing part of its job.
That is an awkward fact for anyone who wishes to divide work neatly into useful motion and wasteful delay. Sometimes the useful thing is to stop.
The film makes the port’s size easy to feel, but the smaller details are more revealing. The operator remains in contact with other people. A container is handled through several connected movements. Knowing where a load ought to be is insufficient when its actual position is uncertain. The work requires judgment at the meeting point of software, equipment and bodies.
Hamburg terminal operator HHLA separately describes the integrated cranes, automated guided vehicles and storage systems at Altenwerder. Automation coordinates a great deal of movement. The operator’s account in the film shows why we should be careful with the phrase without human help.2
Someone designed the system. Someone maintains it. Someone must know what a warning means and what evidence is needed before work starts again. Some work disappears; other work moves to a less visible place.
The fans we have been following could travel through a container terminal, though the documentary does not trace them and we will not put our imaginary shipment aboard a real ship. What the film gives us is a closer view of the kind of work hidden behind a sentence such as the goods have reached the port.
Reached where, exactly? The harbor approach? The berth? The storage yard? A customs release point? The truck that will take them away?
A port is a place. Arrival is a sequence.
The box around the box
Your fan travels in a retail carton. That carton may travel with many others inside a steel container. Standard container dimensions and handling points allow different parts of a transport system to work with the same large unit. Goods can move between ship, truck and train without every carton being individually carried across every boundary.
This is a tremendous practical convenience. It also creates a new scale at which people must coordinate. Someone has to pack the container, establish its weight, secure the contents and arrange for the whole unit to move. The box has made some tasks simpler by gathering them together. It has not made their details irrelevant.
The International Maritime Organization’s rules require the verified gross mass of a packed container to be available for stowage planning before it is loaded onto ships covered by the requirement. The weight includes the container and what has been packed inside. A crane may be able to lift a box that is still unsafe to place in the planned position on a ship.3
Where containers sit affects more than which one comes out next. A ship must remain stable. Loads need to be secured. Different cargoes can have different handling and safety needs. A beautiful arrangement for fast unloading would be a poor bargain if it made the voyage unsafe.
This helps explain a common error in the way we hear port statistics. A TEU is a twenty-foot-equivalent unit, a standard measure of container capacity or throughput. A forty-foot container normally counts as two TEU. Ten million TEU does not mean that ten million separate boxes passed a particular person on the dock. Nor does a count of container movements tell us directly how many unique products reached final customers.
Weight, capacity, movements and value are different measures. A box full of light, expensive goods and a box full of heavy, inexpensive goods can occupy similar space while producing very different totals in other columns. We should not force one number to answer every question simply because it is large enough to sound impressive.
Our fan adds another small complication. Its carton holds some air. A bulky finished appliance may use up container space before it uses up the allowed weight. A shipment of dense metal parts might encounter the opposite limit. A change in packaging can therefore affect transport needs, though it must still protect the product. Removing every piece of protective material can save space and deliver a more compact collection of broken fans.
The work of packing is not glamorous. The goods are grateful for it anyway.
There must be somewhere to put it
A ship has arrived. Why not unload it at once?
Begin with the obvious: it needs a suitable place to berth and equipment that can reach and handle its cargo. Then look inland. If the storage yard is full, unloading creates a new problem. If trucks cannot collect containers, the yard stays full. If the road is blocked or the rail connection is unavailable, moving the box off the ship has not completed the job.
A queue at one stage can be the visible result of trouble at another.
Imagine a terminal that can unload one thousand units during a shift, while the onward system can remove only eight hundred. The remaining two hundred need somewhere to wait. A little spare space absorbs the difference for a while. If the mismatch continues, the space fills. The crane’s ability to lift faster has not fixed the limit beyond the gate.
These are invented numbers, but the arithmetic exposes why one impressive machine cannot guarantee a good whole journey. A port system joins activities with different capacities, working hours and constraints. When several ships arrive close together after being delayed elsewhere, even a capable terminal can face a difficult burst of work.
This is also why a single ranking needs to be read with care. The World Bank’s Container Port Performance Index focuses on the time container ships spend in port. That is valuable information about a costly stage of the journey. It is not a complete score for inland delivery, worker safety, environmental quality or every kind of cargo a port handles.4
Imagine two ports. At one, a ship is unloaded quickly, but boxes wait a week for collection. At the other, the vessel spends a little longer alongside while freight moves onward steadily. A ship-time measure may favor the first. A buyer waiting for a particular carton may prefer the second. Neither person has necessarily misread the clock; they are timing different things.
An efficient handover requires a place for the next activity to happen. That place may be physical space, a free truck, a rail slot or a person authorized to release the load. When planners optimize one stage while assuming that the next stage will somehow cope, they often move waiting rather than remove it.
The same is true of arriving early. A vehicle that reaches a gate before its receiving slot may have gained travel time only to spend it parked. Early information can be helpful. Early cargo requires somewhere safe and lawful to go.
The larger the shipment arriving at once, the more preparation its arrival asks of the receiving system. Large vessels can carry goods efficiently, but their calls may place heavy demands on cranes, yards and inland links. A port that wishes to serve them needs to judge the whole sequence, including who pays for the supporting roads and services. The ship’s scale does not automatically become everyone’s saving.
The shortcut that needs water
A shipping route is not simply a line through empty ocean. It is a choice among passages with different physical limits, services, charges and risks.
Canals make the point especially clearly. A map can show a thin blue connection that saves a great deal of travel. Using that connection depends on the canal continuing to function under the conditions ships actually face.
During the 2023–24 drought, the Panama Canal Authority restricted daily transits and allowable drafts as it managed low water levels. The canal’s lakes also supply water for people. The authority reported that deep-draft transits in its 2024 fiscal year were down 21 percent from the preceding fiscal year under the temporary water-saving measures.5
That is a dated episode, not a statement that the same restriction is in force today. It reveals a connection that a route map can hide. A ship’s shortcut can depend on a freshwater system that also has duties on land.
Suppose a ship can pass only with a lighter load. One response is to carry less. Another is to wait, choose a different route, or move some goods by another means. Each changes the economics of the journey. A restriction on depth need not close a canal completely to matter. It can change how much cargo a vessel can carry on a given transit and how buyers compete for the available service.
A merchant may see the problem as a delayed delivery. A household near the water system may see it as a question of water security. Both are real. The cargo’s commercial value does not give it an automatic claim over every other use of the resource.
We should also resist turning a single drought into a complete climate attribution study. Weather, water management, demand and long-term climate risks require their own evidence. The immediate lesson is already strong: a trade route uses a landscape. It does not float free of it.
Now consider the route through the Red Sea and Suez Canal. Attacks on commercial shipping in 2023 and 2024 placed crews and vessels in danger and led many services to divert around southern Africa. In May 2024, the IMO called for attacks on ships and seafarers to end.6
A detour looks like an extra curve on a global map. To the people aboard, it can mean more days at sea. To a buyer, it can mean a later delivery. To a carrier, it can mean needing more vessel time to offer the same frequency of service. A route chosen to reduce immediate danger can still carry substantial costs.
The first duty here is plain: seafarers are people at work, not a disposable allowance in the price of trade. Any account that begins with freight rates and never reaches the crew has chosen too small a subject.
More miles for the same goods
UNCTAD reported that maritime trade volume grew 2.2 percent in 2024, while transport work measured in ton-miles grew 5.9 percent. Rerouting increased distances. The two figures show why the amount of cargo and the work required to carry it can move at different speeds.7
Worldwide maritime trade growth in 2024 compared with 2023
Annual growth (%)
| Measure | Annual growth |
|---|---|
| Trade volume in tons | 2.2% |
| Transport work in ton-miles | 5.9% |
Source: UNCTAD, Review of Maritime Transport 2025. View the original full-size chart
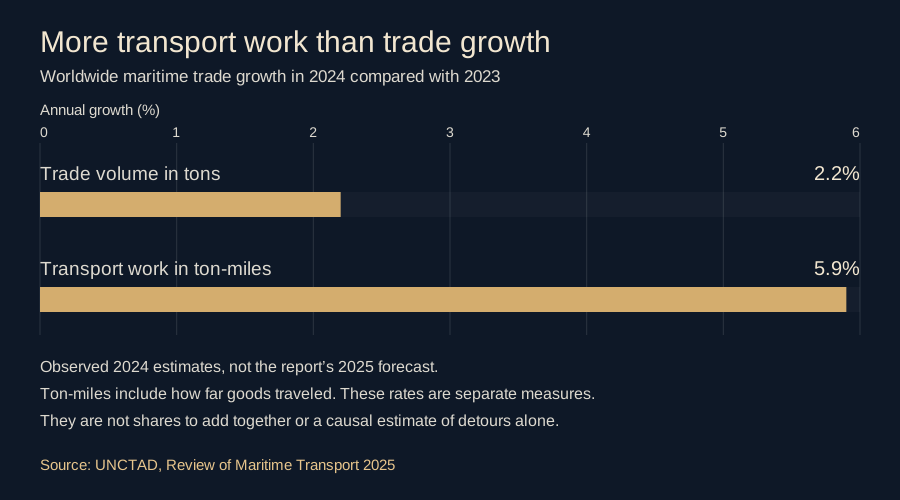
In 2024 the volume of maritime trade rose 2.2%, while ton-miles rose 5.9%. The second measure includes how far goods traveled. These are growth rates in different measures, not shares to add together or a causal estimate of detours alone.
A ton-mile combines weight and distance. Carrying one ton for one thousand miles produces one thousand ton-miles of transport work. Carrying that same ton for fifteen hundred miles produces fifteen hundred ton-miles. The cargo has not become half again as abundant. Its journey has become longer.
Take a simple shipping service with a seventy-day round trip. If it offers one departure every seven days, it needs ten ships in the rotation under this stripped-down example. Lengthen the round trip to eighty-four days while keeping the weekly departures, and it needs twelve. We have ignored differences in vessel size, maintenance, port delays and many operational details. The point is that time itself uses capacity. Two extra ships may be needed merely to preserve the same weekly rhythm.
If the carrier does not have those ships available, it has choices. It can accept less frequent service, alter the schedule, redeploy vessels from another route, or try to recover time elsewhere. Moving a vessel from another service may create a new gap there. A disruption can spread without the affected canal appearing anywhere near the second customer’s country.
Longer journeys also keep containers occupied longer. A box still at sea cannot be used immediately to load another shipment at the origin. The world can have many containers in total and too few empty ones in the place where exporters need them. Counting the fleet is not the same as locating the available equipment.
Imagine a library with enough books for every reader, except that all the books are on the bus returning from a distant branch. The inventory total is excellent. The person at the desk is less impressed.
The analogy has a limit: containers are not interchangeable in every respect, and shipping services involve their own contracts and equipment needs. But it helps explain why a shortage can be about position and timing rather than the physical nonexistence of an object.
More distance does not automatically imply an identical percentage increase in every cost. Fuel, speed, vessel type, load, canal charges, insurance and the schedule all matter. Avoiding a toll can offset part of a longer route’s expense. Sailing faster may recover some time while using more fuel. The net result needs to be calculated for the actual service.
Still, there is no serious sense in which the extra miles are merely a story on the news. They occupy ships, crews, boxes and money that could otherwise be doing something else.
The rate that is not the retail price
A headline says shipping costs have doubled. Lena wants to know whether she must double the price of her fans.
No.
First ask what doubled. A quoted spot rate applies to a particular shipment or market measure at a particular time. A business with an existing contract may face different terms. An index may cover specified routes and container sizes. Some costs and surcharges are included; others may be separate. A global-looking number can conceal very different conditions across directions of travel.
For example, the Freightos Baltic Index uses short-term spot tariffs and related surcharges for defined trade lanes, expressed for forty-foot containers. It is a valuable measure of that market. It is not the average total transport bill of every importer.8
Second, ask how much of the product’s cost was shipping in the first place.
Suppose, for illustration, that getting a fan from the overseas loading port to its destination port costs $2 per fan in a well-filled shipment. Assume all its other costs to the seller are $18. The total in this simplified account is $20. If the ocean cost doubles to $4 while those other costs stay unchanged, the total becomes $22, a rise of 10 percent. The freight component doubled. The whole cost did not.
This example is not an estimate for actual fans. It leaves out possible changes in inland transport, insurance, financing, exchange rates and margins. Those could move too. It simply prevents a percentage measured on one small component from being applied carelessly to the whole.
The effect can differ greatly by product. A bulky, low-value item may carry a larger freight cost relative to its selling price than a small, expensive one. A small importer may not have the same terms as a large buyer. A route with few alternatives can differ from one with many services. Someone needing goods urgently may pay more than someone able to wait.
Then comes the question of who absorbs the increase. A retailer may accept a smaller margin for a while. It may have old stock bought under cheaper conditions. A supplier may change the price only when a contract renews. A business may pass on some or all of the increase, depending on costs, demand and competition. The customer’s price is the result of these decisions and conditions, not a direct display of one shipping index.
There is good reason to take freight shocks seriously without pretending that their effect is mechanical. In a 2022 working paper, Yan Carrière-Swallow and colleagues studied shipping-cost changes and inflation across countries over 1992–2021. Their main shipping measure was the Baltic Dry Index, which concerns dry-bulk transport, not container spot quotes. They found effects on import prices and later consumer inflation, with differences across economies.9
That research supports the connection between transport costs and prices. It does not allow us to take today’s change in one container quote and announce tomorrow’s inflation rate. A useful economic estimate explains a relationship under studied conditions; it does not abolish the need to inspect the present case.
For a household, the distinction may offer little immediate comfort when prices rise. It does help locate the problem. If a retailer’s price change greatly exceeds the increase in its freight bill, freight alone is not a complete explanation. Other costs or margins may have changed. Asking for the full account is reasonable. Accusing a particular seller of deception without that account is not.
The journey leaves something behind
A longer route can bring goods safely around danger and still increase environmental burdens. These facts can be true together.
The IMO’s Fourth Greenhouse Gas Study estimated that total shipping, including international and domestic shipping and fishing, accounted for 2.89 percent of human-caused carbon dioxide emissions in 2018. That is a dated, broadly defined shipping estimate. It should not be relabeled as the current share from container ships alone.10
The scale matters because people sometimes hear that ocean transport can be efficient per ton moved and conclude that its total emissions are negligible. Efficiency per unit and total impact are separate questions. A large amount of relatively efficient movement can still produce a large total burden.
At the same time, the number of border crossings is a poor shortcut for a product’s environmental footprint. Production methods, electricity sources, materials, load factors, transport modes, use and disposal all matter. A nearby factory using more emissions-intensive production can be worse on some measures than a distant one using less. Air-freighting a small urgent shipment can pose a different comparison from moving a full container by sea. The answer belongs to a defined product and route, not to the adjective local.
Our fan makes this plain at a household scale. A design that uses less material but fails quickly can require another product to be made and shipped. A repairable model may stay useful longer, provided repairs actually occur and replacement parts are available. An efficient motor can affect electricity use after the transport story has ended. A smaller carton might reduce space needs in shipping, while inadequate protection could increase damage and waste.
We need to count the parts of the life that our decision changes. We should be especially suspicious when someone chooses the boundary of the calculation only after learning which boundary makes their preferred answer look best.
There are local burdens as well. Trucks move through neighborhoods. Terminals occupy land. Ships and equipment create noise and air pollution. Changes in fuel and technology can improve some of these conditions, while construction or rerouting can shift costs elsewhere. The people living near a port have a claim on the conversation even if they never order our fan.
This is not a demand that every purchase come with a private environmental research project. It is an argument for businesses and public institutions to make better information available and for rules to include costs that a private invoice can omit. A low delivered price does not prove that all costs have been paid by the buyer.
What the schedule asks of a person
Back at Hamburg, the documentary’s tug crew speaks about knowledge that cannot be reduced to the size of an engine. Wind, current, tide and the movement of a much larger vessel shape the task. The crew works together to get the ship into position. The film’s details belong to its recorded episode, not to every operation or every present-day tug.1
What we can carry from the scene is respect for the kind of competence involved. A huge vessel does not become manageable merely because a smaller vessel has enough horsepower on paper. Someone has to use that power at the right moment, from the right place, while reading a changing situation.
A schedule asks people to coordinate. An unreasonable schedule asks them to absorb the gap between the plan and the world.
Consider a driver told to collect a container at noon. The box is not ready. The driver waits. If the warehouse still demands arrival at the original time, the delay has been passed to the person with the least ability to remove it. The pressure to hurry on the road is a consequence of earlier decisions. Calling it an individual time-management problem would be an evasion.
Or consider a terminal that restores its schedule after a disruption by relying on repeated extra shifts. Some overtime may be wanted and well paid. Fatigue and family time still deserve attention. The ability to call on people in an emergency does not justify arranging ordinary operations as a permanent emergency.
Workers also need room to stop when a condition is unsafe. The crane’s lockout makes that principle visible in machinery. People need a similar practical protection: a way to raise a concern without being treated as the obstacle to be removed. A safety instruction is weak if everyone knows that obeying it will be punished through lost work or blame.
There are hard choices. A delayed ship costs money. Missing one connection can upset another. Customers may be waiting for urgently needed goods. Those pressures make competent decisions more important, not less. Safety and service can conflict in a particular moment; pretending the conflict does not exist leaves it to the least powerful person to resolve alone.
The proper response is to plan for the work that safe movement actually requires and to learn from disruptions afterward. Why was the information missing? Why did two services depend on the same narrow window? Which delay was avoidable, and which was a reasonable response to danger? What would have reduced the cost without asking someone to gamble with a body?
These are better questions than Why did the port stop?
A promise stretched across water
Lena receives a revised arrival date. The shipment is still moving, but the route is longer. She checks which fans are already in the warehouse and which customer orders depend on the delayed boxes. The useful response begins with this distinction. Cargo that exists somewhere in the network is not the same as stock available to sell today.
She can bring forward another delivery if the goods and service exist. She can warn customers and avoid making promises she cannot keep. She can review the next order and ask whether the same route remains appropriate. What she cannot do is make the extra days disappear by insisting that her customers are important.
They are important. So are the customers of the other businesses whose goods are on the same ship.
The detour has turned distance into a claim on time. Time then becomes a claim on capacity, finance and patience. The cost appears in several places, sometimes long after the original route changed. A shipment can reach its destination while leaving a supplier short of cash, a worker short of rest or a retailer short of stock for the following week.
Yet a longer route can also be evidence that the system has found a way to continue. A network with no possible detour would be cheaper to draw and more frightening to depend on. We should judge adaptation by the service it preserves, the danger it avoids and the costs it imposes, rather than treating every extra mile as proof that trade has failed.
The ocean leg is only one interval in the fan’s life. Its importance becomes clearest when the next box is late and the last box on the shelf has already been sold. At that point, the difference between a warehouse that looks beautifully empty and one that holds a little extra can become several days of ordinary life.
The warehouse manager opens the door and begins to count.
Sources and notes
Footnotes
-
WELT Documentary, Big Ships & Heavy Load — Hard Work at the Port of Hamburg, uploaded April 18, 2021. Crane interruption: approximately 12:02–13:27; tug operations: 01:12–09:16 and 17:07–21:25. The supplied transcript was read in full. Upload date is not asserted as filming date. Worker roles are used because automatically transcribed names are unreliable. Old throughput claims and inconsistent cargo weights are not used. ↩ ↩2
-
HHLA, “AGV development”, for Altenwerder’s integrated automated systems. The technical description corroborates the type of workflow; it is not independent evidence identifying every location or incident in the film. ↩
-
IMO, Verification of the gross mass of a packed container and Code of Safe Practice for Cargo Stowage and Securing. These sources describe safety requirements and principles, not a claim that every shipment complies. ↩
-
World Bank, Container Port Performance Index, for the vessel-time measure. The contrasting ports and numerical unloading example are invented to explain measurement scope. ↩
-
Panama Canal Authority, FY2024 financial and operating results. The reported decline concerns deep-draft transits in fiscal 2024, not all vessel movements or cargo tonnage. This chapter makes no claim about restrictions still in force in September 2026. ↩
-
IMO, “IMO condemns ‘illegal, unjustifiable’ attacks on ships in Red Sea”, May 24, 2024. UNCTAD’s report cited below supplies the broader rerouting context. ↩
-
UN Trade and Development, Review of Maritime Transport 2025, for 2024 volume growth of 2.2% and ton-mile growth of 5.9%. The original figure shows reported historical growth; it omits the report’s projections for later years. The seventy/eighty-four-day service example is original simplified arithmetic, not an observed carrier schedule. ↩
-
Freightos, Freightos Baltic Index methodology and description. No proprietary rate series or chart is reproduced. The $2/$18/$4 fan example is hypothetical and does not predict price pass-through. ↩
-
Yan Carrière-Swallow, Pragyan Deb, Davide Furceri, Daniel Jiménez and Jonathan D. Ostry, Shipping Costs and Inflation, IMF Working Paper 22/61, March 2022. The baseline covers 46 countries over February 1992–December 2021, with wider-sample robustness checks. The Baltic Dry Index must not be confused with the container index in the preceding note. ↩
-
IMO, Fourth Greenhouse Gas Study 2020, and its executive summary, table 1, for the estimated 2018 share of human-caused CO2 emissions attributable to total shipping. The CO2 share and the report’s separate total-greenhouse-gas estimate must not be interchanged. The discussion of the fan’s design and life is an analytical illustration, not a completed life-cycle assessment of an actual product. ↩